°
°
India Temperature Map
An open temperature platform: many independent sources, side by side, with hyperlocal ground sensors wherever they exist.
A live map and trends view that layers current readings from open feeds over a national grid, then overlays ground-sensor networks wherever they actually report, so the messiness of the underlying sources is legible instead of papered over.
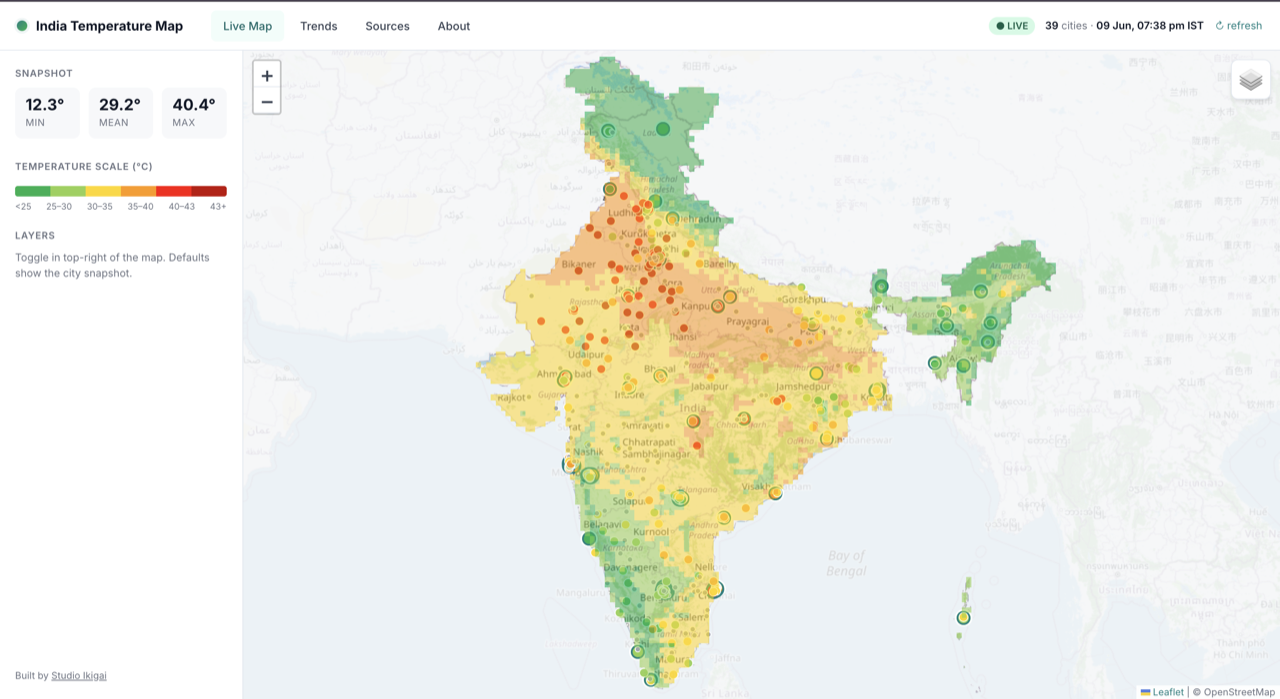
Many sources, reconciled in one view
Coverage spans the full territorial extent, mainland plus the islands and the northern territories, clipped to the landmass with a proper country polygon rather than a rough bounding box.
Temperature data exists. Getting to it doesn’t
India’s temperature is measured many times over, by global reanalysis models, regulatory air-quality networks, private sensor fleets and the national met department. Almost none of it is comparable, and much of it is gated. For anyone trying to answer a simple question, how hot is it here right now and how much do the sources agree, the honest answer requires stitching together half a dozen feeds and knowing which to trust. This platform does that stitching in the open.
Built at the model’s native resolution
The map layers current readings from open feeds over a national grid, then overlays ground-sensor networks wherever they actually report. The grid is built at the native 0.25° resolution of the reanalysis model behind it, roughly 27 by 25 km per cell, not interpolated to look smoother than the data really is.
Honest about what the data is
Rather than blending sources into one averaged number, the platform shows them per location, side by side, so disagreement between providers is visible. A source-status table says exactly which providers reported on the last run and why the others didn’t. The city snapshot is default; grid, ground sensors and air-quality stations toggle on demand, so the reader controls how much detail is on screen.
The hard part of climate data isn’t the visualisation. It is being honest, in the interface itself, about where the numbers come from and where they stop.
Open, transparent public infrastructure
A live map and trends view anyone can read, paired with a comparison layer that makes the messiness of the underlying sources legible instead of papering over it. Released under an open licence, it documents its own gated sources and is built to keep running with minimal upkeep, in the spirit of the data it draws on.