°
°
India Datacenter Watch
An open, community-accountability map of every data center across India, with a source for every facility.
A public map that connects each data-center facility to its estimated water and power cost and the community response around it, with a citation on every row. Built as open infrastructure anyone can audit, fork or extend.
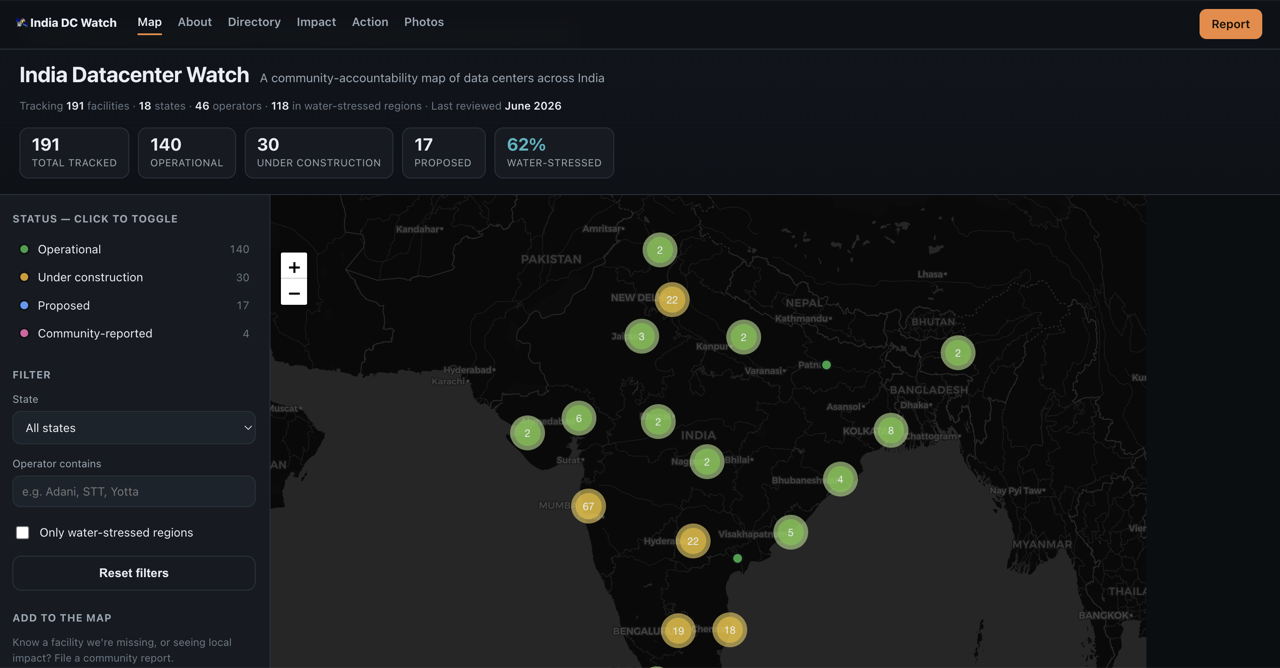
A live snapshot, computed from the data
The counts update from the open dataset, not hand-typed. Last reviewed June 2026.
Capacity is growing faster than scrutiny
India’s data-center buildout is accelerating with the AI boom, but operators rarely disclose facility-level water and power figures, leaving communities to estimate the impact of what is rising next door. The facilities, the resource numbers and the local reporting all exist, but scattered across press releases, industry trackers and regional newsrooms. No single public place connects a campus to its water draw, its grid load, and the residents organising around it.
One sourced row per facility
A single open dataset, every row carrying a public source URL, drives the map, the live statistics and the impact estimates. Status, operator, city, IT load and a water-stress flag are structured so the whole site filters from one place. Estimates use India’s grid emission factor and India-average efficiency ranges, with the methodology shown, not hidden.
Accountability, built into the interface
Every facility carries a Source link, and the filtered set downloads as CSV: no claim without a citation. Where exact siting isn’t public, markers sit at city centroids and the popup says so. Residents file reports through a reviewed pipeline, flagged as community-reported until verified. And an Action layer tracks policy, clearances, court cases and organising, because impact is only half the story.
The job isn’t to accuse. It is to put the facilities, the numbers and the reporting in one public, sourced place, and let people see for themselves.
A public watch on a fast-moving buildout
A live, sourced map that connects each facility to its estimated resource cost and the community response around it, standing on the reporting of newsrooms and research groups across India and connecting their work in one place. It is open source under the MIT licence, with code and data on GitHub and a report form that opens a pre-filled public issue.